博客

  • 不遵循交易规则的人总会被打脸

    在空头趋势中融券做空,这叫顺势而为

    空头趋势结束,多头行情开始,应该反手做多,这也是顺势而为

    然而有的人总是因为各种心理问题无法坚守交易规则,最终损失惨重(有可能是做空亏损惨重,也有可能是多头行情来临之后没有反向做多导致丧失盈利机会)

    让我们来看两组经典的案例:

    人福医药的合同在2024年7月9日到期,到期后融券的难度加大,市场上的券源越来越少。按照基本的常理,券源缩减,空头的做空资源缺失,必将迎来多头的反攻。

    最后一次做空人福医药是在2024年7月8日从此之前几乎很难在借到券源头

    在券源不断较少的趋势下,人福医药在2024年7月11日迎来了多头大反攻,从此之后夺取趋势开始一发不可收拾

    从7月11日至今(8月5日)人福医药已经上涨27.68%

    下面我们再来看另外一个例子:燕京啤酒

    2024年7月5日结掉合约

    结掉合约当日的交易:35000股

    燕京啤酒的股价在2024年7月11日

    也就是在我结束做空的4个交易日后,多空强势反攻,当日上涨5.63%,从这刻起“燕京啤酒”开始了不可逆的多头趋势。从2024年7月11日算,截止到目前2024年8月5日。这只股票已经上涨17.014%。如果是在2024年7月10日买入至今则上涨18.71%

    股市交易特别需要:“心性”。从没有交易章法到寻找出一个高胜率的交易章法,再到坚持自己的章法原则,是一个非常困难且痛苦的过程。

    当你真正做到的时候,股市交易就不再那么让人懊恼,自身的心态也会更平和

    在这一条路上,我还有很长一段路要走。因为我们做交易更多的时候不是和市场博弈,而是和自己的人性,和他人的人性做博弈。

    你需要克服/控制自己的:恐惧、贪婪、无知、执念

    这里的执念特指:在明显的空头趋势行情下,你是做多一方,但却抛弃数据事实固执的认为行情”今天收盘前就会反转”。或者是一些特别的幼稚理念,例如:保持高胜率(我在天齐锂业和同庆楼这两只股票上,最大的败笔就是这个幼稚的“保持高胜率”执念了,因为在这两只股票之前我的交易胜率超过96%,我不想因为这两只股票拉低我的交易胜率)。

  • Tushare 日线数据的获取

    通过以下代码你可以获取著名的金融数据平台Tushare的股票日线交易数据,存入数据表

    代码的优势在于:

    • 1.可以自定义数据的获取的范围,主要通过Define time period的日期参数可调整实现
    • 2.可以获取自己想要的股票数据,主要通过数据表stock_basic来确定ts_code范围(这里附加的前提就是你从Tushare获取基础信息时要按照自己的需求过滤不需要的数据,例如:不考虑ST、和自己没有交易资格的北交所数据等)
    • 3.Rate limiting和time.sleep进一步增强了再数据获取时的请求限制,并避免了因代码逻辑不严谨导致的数据请求丢失
    • 4.同时代码还具有batch_size的分批请求和tqdm的数据请求进度,以及数据是否已经存在的校验判断Function to check if data already exists
    import pandas as pd
    from sqlalchemy import create_engine
    from sqlalchemy.orm import sessionmaker
    from tqdm import tqdm
    import concurrent.futures
    import tushare as ts
    from threading import Semaphore, Timer
    import time
    
    # Initialize tushare
    ts.set_token('your_token')
    pro = ts.pro_api()
    
    # Create database connection
    engine = create_engine('mysql+pymysql://username:password@localhost:3306/stock')
    Session = sessionmaker(bind=engine)
    session = Session()
    
    # Get stock list with list_date
    query = "SELECT ts_code, list_date FROM stock.stock_basic"
    stock_list = pd.read_sql(query, engine)
    
    # Define time period
    default_start_date = '20240802'
    end_date = '20240802'
    
    # Rate limiting
    CALLS = 1500 # 每分钟最大请求次数
    RATE_LIMIT = 60 # seconds
    BATCH_SIZE = 1000 # 每次请求的股票代码数量
    
    # Create a semaphore to limit the number of API calls
    semaphore = Semaphore(CALLS)
    
    # Function to periodically release the semaphore
    def release_semaphore():
        for _ in range(CALLS):
            semaphore.release()
    
    # Start timer to release semaphore every minute
    Timer(RATE_LIMIT, release_semaphore, []).start()
    
    # Function to check if data already exists
    def data_exists(ts_code, trade_date):
        query = f"SELECT 1 FROM daily WHERE ts_code='{ts_code}' AND trade_date='{trade_date}' LIMIT 1"
        result = pd.read_sql(query, engine)
        return not result.empty
    
    # Define retry decorator
    def retry():
        def decorator(func):
            def wrapper(*args, **kwargs):
                for _ in range(10):
                    try:
                        result = func(*args, **kwargs)
                        return result
                    except Exception as e:
                        print(f"Error occurred: {e}. Retrying...")
                        time.sleep(30)
                raise Exception("Maximum retries exceeded. Function failed.")
            return wrapper
        return decorator
    
    # Define function to fetch and insert stock data
    @retry()
    def fetch_and_insert_stock_data(ts_code, list_date, end_date, engine):
        # Determine start_date based on list_date
        start_date = max(list_date.replace('-', ''), default_start_date)
    
        # Check if data already exists
        if data_exists(ts_code, end_date):
            return f"Data already exists for {ts_code} on {end_date}"
    
        # Wait on semaphore to respect rate limiting
        semaphore.acquire()
        try:
            # Fetch data from tushare
            stock_data = pro.daily(ts_code=ts_code, start_date=start_date, end_date=end_date)
    
            # If data is not empty, insert it into the database
            if not stock_data.empty:
                # Map API fields to database fields
                stock_data.rename(columns={'vol': 'volume'}, inplace=True)
                stock_data.to_sql('daily', engine, if_exists='append', index=False, method='multi')
            return ts_code
        finally:
            # Release the semaphore after the operation
            semaphore.release()
    
    # Initialize progress bar
    total_stocks = len(stock_list)
    pbar = tqdm(total=total_stocks, desc="Fetching stock data")
    
    def process_batch(batch):
        with concurrent.futures.ThreadPoolExecutor() as executor:
            futures = {
                executor.submit(fetch_and_insert_stock_data, row['ts_code'], row['list_date'], end_date, engine): row['ts_code']
                for index, row in batch.iterrows()
            }
            for future in concurrent.futures.as_completed(futures):
                ts_code = futures[future]
                try:
                    data = future.result()
                    pbar.update(1)
                except Exception as exc:
                    print(f'{ts_code} generated an exception: {exc}')
    
    # Process stocks in batches
    batch_size = BATCH_SIZE
    for i in range(0, total_stocks, batch_size):
        batch = stock_list.iloc[i:i + batch_size]
        process_batch(batch)
        time.sleep(60) # Wait to respect rate limits
    
    # Close progress bar
    pbar.close()
    

    股市交易,学会使用数据进行市场行情研究和是否买入/卖出判断,要比通过有心人捏造并通过媒体报道的消息更具有参考意义。

    前提是你要能看得懂“数据的内涵意义”!

  • 综合MA/EMA/RSI以及成交量数据的股票趋势判断代码

    最终呈现的效果

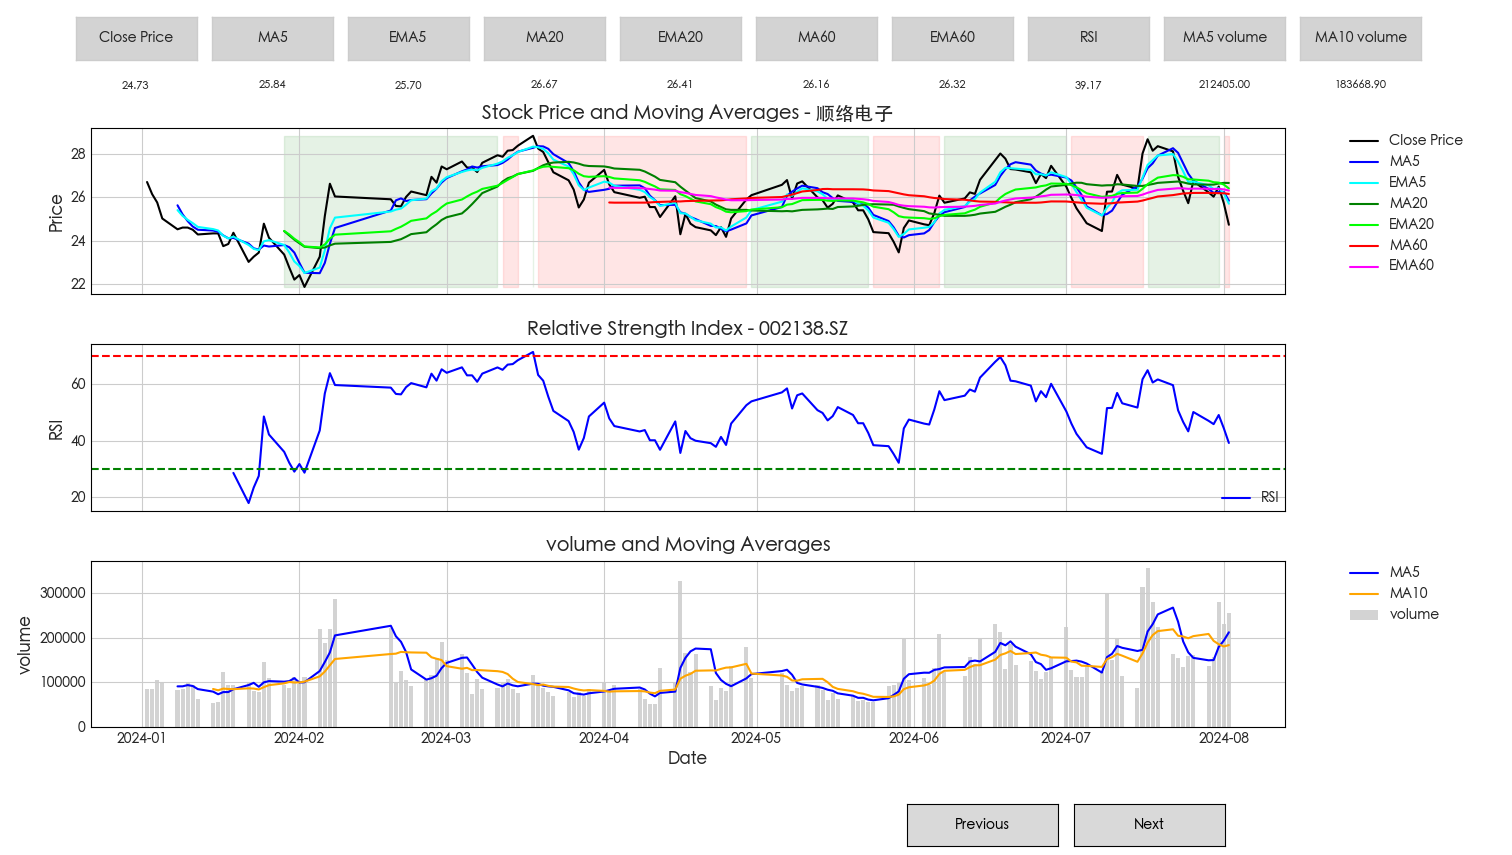
    这个代码的优势是可以清楚的看到当前的短期动能EMA20比较MA20处于上涨趋势还是下跌趋势。针对这部分逻辑你可以尝试不同的指标来构造结果,例如用EMA20和EMA60 或者用EMA60和EMA120来做比较之类,具体的情况根据个人的数据敏感度偏好自由抉择。不同的指标最终会体现出不同的波动趋势可能性(短期与长期)

    # 添加EMA>MA和EMA<MA的标记
    ax1.fill_between(df['trade_date'], df['close'].min(), df['close'].max(),where=(df['EMA20'] > df['MA20']), color='green', alpha=0.1, label='Uptrend (EMA20 > MA20)')
    ax1.fill_between(df['trade_date'], df['close'].min(), df['close'].max(),where=(df['EMA20'] < df['MA20']), color='red', alpha=0.1, label='Downtrend (EMA20 < MA20)')
    

    通常情况下如果当前价格趋势处于红色色块,若没有特别重大的利好,带来多头的强势入场,大概率这只股票是要持续下跌的。

    完整的代码如下

    import pandas as pd
    import matplotlib.pyplot as plt
    from sqlalchemy import create_engine
    import matplotlib.font_manager as fm
    from matplotlib.widgets import Button
    import ta  # 导入ta库
    
    # 数据库连接设置
    engine = create_engine('mysql+pymysql://username:password@localhost:3306/stock')
    
    current_index = 0  # 当前显示的股票索引
    
    def fetch_stock_data(ts_code):
        # 查询股票数据
        query = f"SELECT * FROM stock.daily WHERE ts_code = '{ts_code}'"
        df = pd.read_sql(query, engine)
        # 转换日期格式
        df['trade_date'] = pd.to_datetime(df['trade_date'])
        # 按照日期排序
        df = df.sort_values(by='trade_date')
        return df
    
    def fetch_stock_name(ts_code):
        # 查询股票名称
        query = f"SELECT ts_code, name FROM stock.stock_basic WHERE ts_code = '{ts_code}'"
        df = pd.read_sql(query, engine)
        if not df.empty:
            return df['name'].values[0]
        else:
            return "Unknown"
    
    def fetch_all_ts_codes():
        query = "SELECT DISTINCT ts_code FROM stock.daily"
        df = pd.read_sql(query, engine)
        return df['ts_code'].tolist()
    
    def fetch_defined_ts_codes():
        query = "SELECT DISTINCT ts_code FROM stock.ambush_stock"
        df = pd.read_sql(query, engine)
        return df['ts_code'].tolist()
    
    # 计算RSI
    def calculate_rsi(data, window):
        rsi = ta.momentum.RSIIndicator(close=data, window=window)
        return rsi.rsi()
    
    def plot_stock_data(df, stock_name, ts_code):
        plt.style.use('seaborn-v0_8-whitegrid')  # 设置图表样式
        global fig, ax1, ax2, ax3, check_buttons, lines, text_objects  # 定义全局变量
    
        ax1.clear()
        ax2.clear()
        ax3.clear()
    
        # 使用 ta 库计算移动平均线和 EMA
        df['MA5'] = ta.trend.SMAIndicator(df['close'], window=5).sma_indicator()
        df['EMA5'] = ta.trend.EMAIndicator(df['close'], window=5).ema_indicator()
        df['MA20'] = ta.trend.SMAIndicator(df['close'], window=20).sma_indicator()
        df['EMA20'] = ta.trend.EMAIndicator(df['close'], window=20).ema_indicator()
        df['MA60'] = ta.trend.SMAIndicator(df['close'], window=60).sma_indicator()
        df['EMA60'] = ta.trend.EMAIndicator(df['close'], window=60).ema_indicator()
    
        df['RSI'] = calculate_rsi(df['close'], 14)
    
        # 计算成交量移动平均线
        df['VOL_MA5'] = ta.trend.SMAIndicator(df['volume'], window=5).sma_indicator()
        df['VOL_MA10'] = ta.trend.SMAIndicator(df['volume'], window=10).sma_indicator()
    
        # 设置字体以支持中文显示
        font_path = '/System/Library/Fonts/STHeiti Medium.ttc'  # 确认字体路径
        prop = fm.FontProperties(fname=font_path)
        plt.rcParams['font.sans-serif'] = prop.get_name()
        plt.rcParams['axes.unicode_minus'] = False
    
        # 第一张子图:Close Price 和 MA
        l1, = ax1.plot(df['trade_date'], df['close'], label='Close Price', color='black')
        l2, = ax1.plot(df['trade_date'], df['MA5'], label='MA5', color='blue')
        l3, = ax1.plot(df['trade_date'], df['EMA5'], label='EMA5', color='cyan')
        l4, = ax1.plot(df['trade_date'], df['MA20'], label='MA20', color='green')
        l5, = ax1.plot(df['trade_date'], df['EMA20'], label='EMA20', color='lime')
        l6, = ax1.plot(df['trade_date'], df['MA60'], label='MA60', color='red')
        l7, = ax1.plot(df['trade_date'], df['EMA60'], label='EMA60', color='magenta')
        ax1.set_ylabel('Price', fontsize=12)
        ax1.set_title(f'Stock Price and Moving Averages - {stock_name}', fontsize=14)
        ax1.legend(fontsize=10, bbox_to_anchor=(1.05, 1), loc='upper left', borderaxespad=0, frameon=False)
    
        # 添加 EMA > MA 和 EMA < MA 的标记
        ax1.fill_between(df['trade_date'], df['close'].min(), df['close'].max(),
                         where=(df['EMA20'] > df['MA20']), color='green', alpha=0.1, label='Uptrend (EMA20 > MA20)')
        ax1.fill_between(df['trade_date'], df['close'].min(), df['close'].max(),
                         where=(df['EMA20'] < df['MA20']), color='red', alpha=0.1, label='Downtrend (EMA20 < MA20)')
    
        # 第二张子图:RSI
        l8, = ax2.plot(df['trade_date'], df['RSI'], label='RSI', color='blue')
        ax2.axhline(70, color='red', linestyle='--')
        ax2.axhline(30, color='green', linestyle='--')
        ax2.set_ylabel('RSI', fontsize=12)
        ax2.set_title(f'Relative Strength Index - {ts_code}', fontsize=14)
        ax2.legend(fontsize=10, loc='lower right', borderaxespad=0, frameon=False)
    
        # 第三张子图:成交量柱状图和成交量MA
        l9 = ax3.bar(df['trade_date'], df['volume'], label='volume', color='lightgray')
        l10, = ax3.plot(df['trade_date'], df['VOL_MA5'], label='MA5', color='blue')
        l11, = ax3.plot(df['trade_date'], df['VOL_MA10'], label='MA10', color='orange')
        ax3.set_xlabel('Date', fontsize=12)
        ax3.set_ylabel('volume', fontsize=12)
        ax3.set_title(f'volume and Moving Averages', fontsize=14)
        ax3.legend(fontsize=10, bbox_to_anchor=(1.05, 1), loc='upper left', borderaxespad=0, frameon=False)
    
        # 清除旧的CheckButtons和文本对象
        if 'check_buttons' in globals():
            for btn in check_buttons:
                btn.ax.remove()
            check_buttons.clear()
    
        if 'text_objects' in globals():
            for txt in text_objects:
                txt.remove()
            text_objects.clear()
    
        # 添加CheckButtons控件
        labels = ['Close Price', 'MA5', 'EMA5', 'MA20', 'EMA20', 'MA60', 'EMA60', 'RSI', 'MA5 volume', 'MA10 volume']
        lines = [l1, l2, l3, l4, l5, l6, l7, l8, l10, l11]
        visibility = [True] * len(lines)
    
        check_buttons = []
        for i, label in enumerate(labels):
            ax_check = plt.axes([0.05 + i * 0.09, 0.93, 0.08, 0.05])
            button = Button(ax_check, label, color='lightgrey', hovercolor='grey')
            button.on_clicked(lambda event, index=i: toggle_visibility(index))
            check_buttons.append(button)
    
        # 添加文本对象以显示指标值
        text_objects = []
        for i, label in enumerate(labels):
            ax_text = plt.axes([0.05 + i * 0.09, 0.88, 0.08, 0.04], facecolor='white')  # 设置背景色为白色
            ax_text.axis('off')  # 隐藏坐标轴
            text = ax_text.text(0.5, 0.5, "", transform=ax_text.transAxes, ha="center", va="center", fontsize=8)
            text_objects.append(text)
    
        def toggle_visibility(index):
            lines[index].set_visible(not lines[index].get_visible())
            update_indicators_text()
            plt.draw()
    
        def update_indicators_text():
            for i, line in enumerate(lines):
                if line.get_visible():
                    ydata = line.get_ydata()
                    if len(ydata) > 0:
                        text_objects[i].set_text(f"{ydata[-1]:.2f}")
                    else:
                        text_objects[i].set_text("")
                else:
                    text_objects[i].set_text("")
    
        update_indicators_text()
    
        plt.draw()  # 更新图表
    
    
    # 更新图表数据
    def update_plot():
        global current_index
        ts_code = all_ts_codes[current_index]
        df = fetch_stock_data(ts_code)
        stock_name = fetch_stock_name(ts_code)
        plot_stock_data(df, stock_name, ts_code)
    
    # 获取所有ts_code
    all_ts_codes = fetch_all_ts_codes()
    
    # 通过SQL查询动态获取股票代码
    #defined_ts_codes = fetch_defined_ts_codes()
    defined_ts_codes = ['002138.SZ', '603017.SH']
    # 过滤所有股票代码,只保留defined_ts_codes中的代码
    all_ts_codes = [code for code in all_ts_codes if code in defined_ts_codes]
    
    def plot_next_stock(event=None):
        global current_index
        ts_code = all_ts_codes[current_index]
        df = fetch_stock_data(ts_code)
        stock_name = fetch_stock_name(ts_code)
        plot_stock_data(df, stock_name, ts_code)
    
    # 初始化图表和按钮
    fig, (ax1, ax2, ax3) = plt.subplots(3, 1, figsize=(15.12, 8.55), sharex=True)  # 设置图表大小
    fig.subplots_adjust(hspace=0.3, right=0.85, top=0.85, bottom=0.15, left=0.06)  # 设置子图间距和边距
    
    # 添加上一个和下一个按钮
    axprev = plt.axes([0.6, 0.01, 0.1, 0.05])  # 调整按钮位置
    axnext = plt.axes([0.71, 0.01, 0.1, 0.05])  # 调整按钮位置
    bnext = Button(axnext, 'Next')
    bprev = Button(axprev, 'Previous')
    
    def next(event):
        global current_index
        current_index += 1
        if current_index >= len(all_ts_codes):
            current_index = 0
        update_plot()
    
    def prev(event):
        global current_index
        current_index -= 1
        if current_index < 0:
            current_index = len(all_ts_codes) - 1
        update_plot()
    
    bnext.on_clicked(next)
    bprev.on_clicked(prev)
    
    # 显示第一个股票的图表
    plot_next_stock()
    plt.show()
    

    针对代码需要改进的点以及需要的数据支持

    • 1.需要从https://www.tushare.pro/ 先获取到日线数据存入自己的数据表
    • 2.针对代码关于字体路径的部分,我是mac电脑做了特殊处理,Windows系统用户可根据自己的实际情况进行调节
    • 3.defined_ts_codes部分定义支持数据表全量ts_code数据计算和展示“此方式比较耗费资源,且在预览切换过程中股票数量太多会有很多无效的数据浪费时间”,也可以手工定义多个ts_code聚焦到自己关注的那一小部分股票,从而提升数据判断效率
  • 入市以来最大的单股亏损

    不得不说在我保持盈利模式之前,更多靠的是运气,因为那时的我还不知道什么叫技术指标,分不清什么叫空头趋势,什么叫多头趋势,全仰仗自己的简单认知:

    我的筹码价格比大多数人低,我的亏损概率就小/亏损幅度就小

    然而当事实啪啪打脸的时候,你再也无法坚信自己的认知是正确的,你开始怀疑,开始疯狂的加仓减少损失,然而这种缺乏止损理念的行为却只会让你越陷越深,亏损越来越大。

    曾经的简单可靠盈利模型

    昨日收盘价低于90%持仓成本的次日买入股票
    买入当日股价大涨,次日逢高抛售

    踩在市场行情趋势上【多头】,傻子都能有很大概率盈利!

    大盘当日也大涨(因为无知,以为自己买入”中金公司”盈利的原因,自己是‘股神’)

    当市场行情的趋势退去,误把运气当“神技”的人总会被市场狠狠的教训

    周线EMA5<EMA10<EMA60,同时收盘价也明显的低于90%持仓成本【强烈买入信号】
    越跌越加仓,期望以此来降低持股成本,在上涨行情时赶紧跑路或大赚一笔
    最终的结果是实在扛不住了,割肉以后“空头行情”依然没停,继续下跌4周,才开始横盘

    这堂课的学费不便宜,交了20万!

    从这一刻起我开始反思,开始学习,学会了空头排列、多头排列、简单移动平均线(SMA)、指数移动平均线(EMA)、MACD、KDJ、RSI、Boll、涨跌(放缩量)

    也许要花很多时间才能把亏损赚回来,也许再也赚不回来了(最坏的结果),但至少此时此刻我知道自己的交易失败是因为什么! 以后再也不会犯这样的错(或者极少会再犯这样的错)