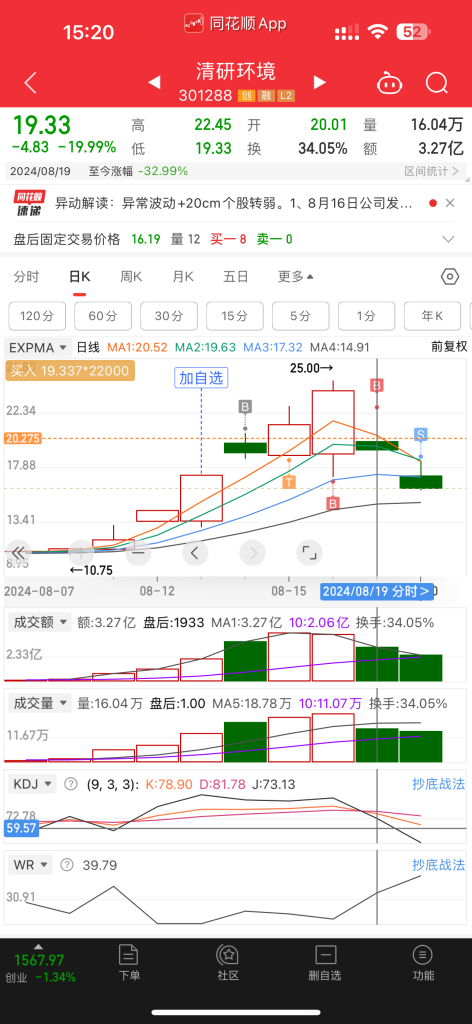
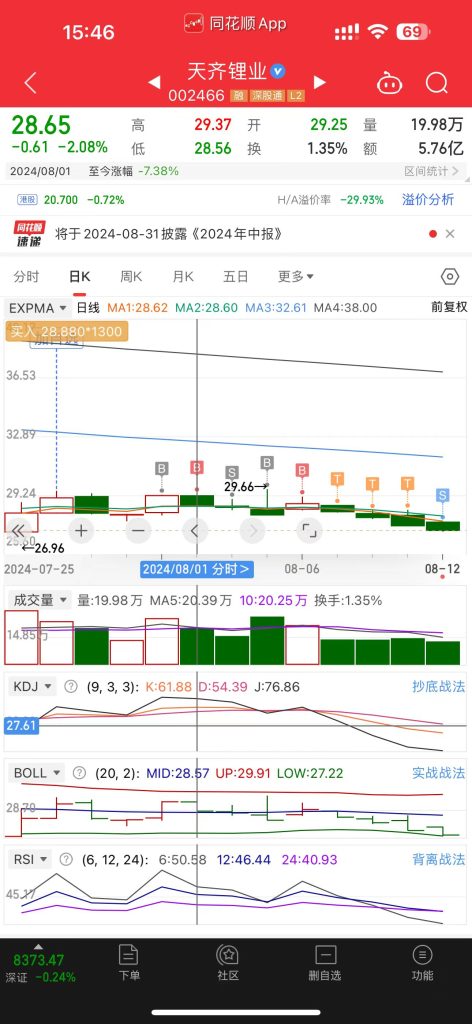
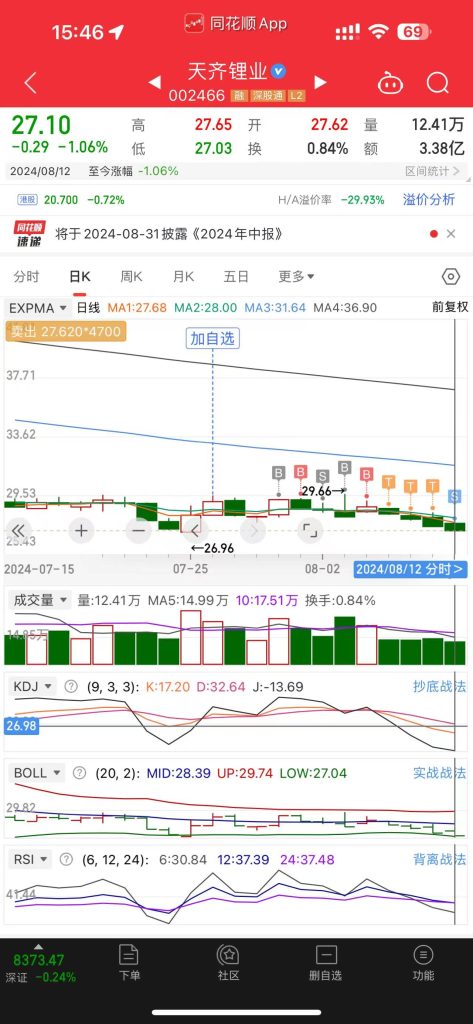
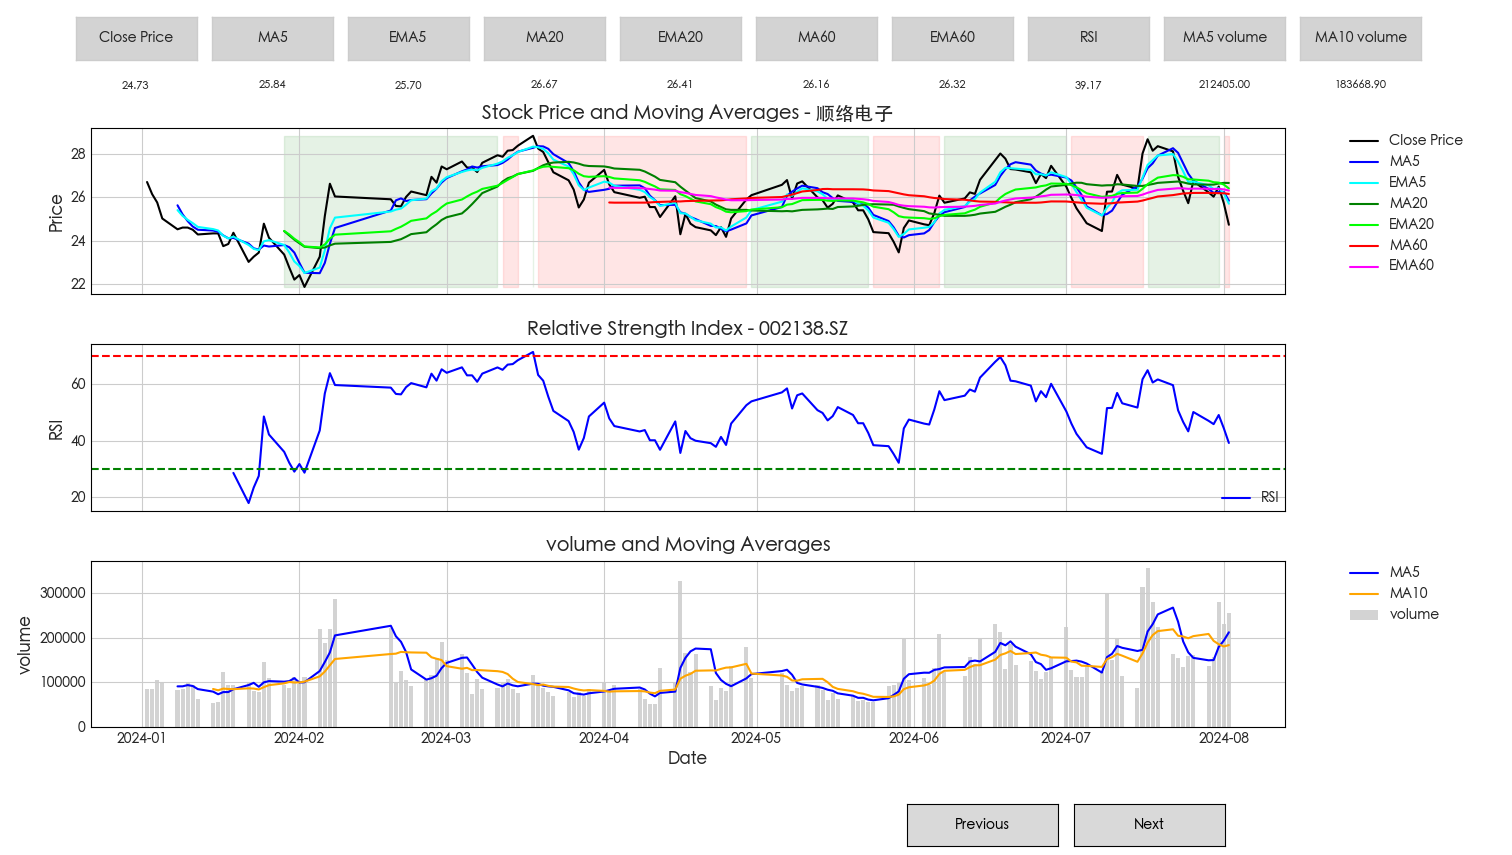
这个代码的优势是可以清楚的看到当前的短期动能EMA20比较MA20处于上涨趋势还是下跌趋势。针对这部分逻辑你可以尝试不同的指标来构造结果,例如用EMA20和EMA60 或者用EMA60和EMA120来做比较之类,具体的情况根据个人的数据敏感度偏好自由抉择。不同的指标最终会体现出不同的波动趋势可能性(短期与长期)
import pandas as pd
import matplotlib.pyplot as plt
from sqlalchemy import create_engine
import matplotlib.font_manager as fm
from matplotlib.widgets import Button
import ta  # 导入ta库

# 数据库连接设置
engine = create_engine('mysql+pymysql://username:password@localhost:3306/stock')

current_index = 0  # 当前显示的股票索引

def fetch_stock_data(ts_code):
    # 查询股票数据
    query = f"SELECT * FROM stock.daily WHERE ts_code = '{ts_code}'"
    df = pd.read_sql(query, engine)
    # 转换日期格式
    df['trade_date'] = pd.to_datetime(df['trade_date'])
    # 按照日期排序
    df = df.sort_values(by='trade_date')
    return df

def fetch_stock_name(ts_code):
    # 查询股票名称
    query = f"SELECT ts_code, name FROM stock.stock_basic WHERE ts_code = '{ts_code}'"
    df = pd.read_sql(query, engine)
    if not df.empty:
        return df['name'].values[0]
    else:
        return "Unknown"

def fetch_all_ts_codes():
    query = "SELECT DISTINCT ts_code FROM stock.daily"
    df = pd.read_sql(query, engine)
    return df['ts_code'].tolist()

def fetch_defined_ts_codes():
    query = "SELECT DISTINCT ts_code FROM stock.ambush_stock"
    df = pd.read_sql(query, engine)
    return df['ts_code'].tolist()

# 计算RSI
def calculate_rsi(data, window):
    rsi = ta.momentum.RSIIndicator(close=data, window=window)
    return rsi.rsi()

def plot_stock_data(df, stock_name, ts_code):
    plt.style.use('seaborn-v0_8-whitegrid')  # 设置图表样式
    global fig, ax1, ax2, ax3, check_buttons, lines, text_objects  # 定义全局变量

    ax1.clear()
    ax2.clear()
    ax3.clear()

    # 使用 ta 库计算移动平均线和 EMA
    df['MA5'] = ta.trend.SMAIndicator(df['close'], window=5).sma_indicator()
    df['EMA5'] = ta.trend.EMAIndicator(df['close'], window=5).ema_indicator()
    df['MA20'] = ta.trend.SMAIndicator(df['close'], window=20).sma_indicator()
    df['EMA20'] = ta.trend.EMAIndicator(df['close'], window=20).ema_indicator()
    df['MA60'] = ta.trend.SMAIndicator(df['close'], window=60).sma_indicator()
    df['EMA60'] = ta.trend.EMAIndicator(df['close'], window=60).ema_indicator()

    df['RSI'] = calculate_rsi(df['close'], 14)

    # 计算成交量移动平均线
    df['VOL_MA5'] = ta.trend.SMAIndicator(df['volume'], window=5).sma_indicator()
    df['VOL_MA10'] = ta.trend.SMAIndicator(df['volume'], window=10).sma_indicator()

    # 设置字体以支持中文显示
    font_path = '/System/Library/Fonts/STHeiti Medium.ttc'  # 确认字体路径
    prop = fm.FontProperties(fname=font_path)
    plt.rcParams['font.sans-serif'] = prop.get_name()
    plt.rcParams['axes.unicode_minus'] = False

    # 第一张子图:Close Price 和 MA
    l1, = ax1.plot(df['trade_date'], df['close'], label='Close Price', color='black')
    l2, = ax1.plot(df['trade_date'], df['MA5'], label='MA5', color='blue')
    l3, = ax1.plot(df['trade_date'], df['EMA5'], label='EMA5', color='cyan')
    l4, = ax1.plot(df['trade_date'], df['MA20'], label='MA20', color='green')
    l5, = ax1.plot(df['trade_date'], df['EMA20'], label='EMA20', color='lime')
    l6, = ax1.plot(df['trade_date'], df['MA60'], label='MA60', color='red')
    l7, = ax1.plot(df['trade_date'], df['EMA60'], label='EMA60', color='magenta')
    ax1.set_ylabel('Price', fontsize=12)
    ax1.set_title(f'Stock Price and Moving Averages - {stock_name}', fontsize=14)
    ax1.legend(fontsize=10, bbox_to_anchor=(1.05, 1), loc='upper left', borderaxespad=0, frameon=False)

    # 添加 EMA > MA 和 EMA < MA 的标记
    ax1.fill_between(df['trade_date'], df['close'].min(), df['close'].max(),
                     where=(df['EMA20'] > df['MA20']), color='green', alpha=0.1, label='Uptrend (EMA20 > MA20)')
    ax1.fill_between(df['trade_date'], df['close'].min(), df['close'].max(),
                     where=(df['EMA20'] < df['MA20']), color='red', alpha=0.1, label='Downtrend (EMA20 < MA20)')

    # 第二张子图:RSI
    l8, = ax2.plot(df['trade_date'], df['RSI'], label='RSI', color='blue')
    ax2.axhline(70, color='red', linestyle='--')
    ax2.axhline(30, color='green', linestyle='--')
    ax2.set_ylabel('RSI', fontsize=12)
    ax2.set_title(f'Relative Strength Index - {ts_code}', fontsize=14)
    ax2.legend(fontsize=10, loc='lower right', borderaxespad=0, frameon=False)

    # 第三张子图:成交量柱状图和成交量MA
    l9 = ax3.bar(df['trade_date'], df['volume'], label='volume', color='lightgray')
    l10, = ax3.plot(df['trade_date'], df['VOL_MA5'], label='MA5', color='blue')
    l11, = ax3.plot(df['trade_date'], df['VOL_MA10'], label='MA10', color='orange')
    ax3.set_xlabel('Date', fontsize=12)
    ax3.set_ylabel('volume', fontsize=12)
    ax3.set_title(f'volume and Moving Averages', fontsize=14)
    ax3.legend(fontsize=10, bbox_to_anchor=(1.05, 1), loc='upper left', borderaxespad=0, frameon=False)

    # 清除旧的CheckButtons和文本对象
    if 'check_buttons' in globals():
        for btn in check_buttons:
            btn.ax.remove()
        check_buttons.clear()

    if 'text_objects' in globals():
        for txt in text_objects:
            txt.remove()
        text_objects.clear()

    # 添加CheckButtons控件
    labels = ['Close Price', 'MA5', 'EMA5', 'MA20', 'EMA20', 'MA60', 'EMA60', 'RSI', 'MA5 volume', 'MA10 volume']
    lines = [l1, l2, l3, l4, l5, l6, l7, l8, l10, l11]
    visibility = [True] * len(lines)

    check_buttons = []
    for i, label in enumerate(labels):
        ax_check = plt.axes([0.05 + i * 0.09, 0.93, 0.08, 0.05])
        button = Button(ax_check, label, color='lightgrey', hovercolor='grey')
        button.on_clicked(lambda event, index=i: toggle_visibility(index))
        check_buttons.append(button)

    # 添加文本对象以显示指标值
    text_objects = []
    for i, label in enumerate(labels):
        ax_text = plt.axes([0.05 + i * 0.09, 0.88, 0.08, 0.04], facecolor='white')  # 设置背景色为白色
        ax_text.axis('off')  # 隐藏坐标轴
        text = ax_text.text(0.5, 0.5, "", transform=ax_text.transAxes, ha="center", va="center", fontsize=8)
        text_objects.append(text)

    def toggle_visibility(index):
        lines[index].set_visible(not lines[index].get_visible())
        update_indicators_text()
        plt.draw()

    def update_indicators_text():
        for i, line in enumerate(lines):
            if line.get_visible():
                ydata = line.get_ydata()
                if len(ydata) > 0:
                    text_objects[i].set_text(f"{ydata[-1]:.2f}")
                else:
                    text_objects[i].set_text("")
            else:
                text_objects[i].set_text("")

    update_indicators_text()

    plt.draw()  # 更新图表


# 更新图表数据
def update_plot():
    global current_index
    ts_code = all_ts_codes[current_index]
    df = fetch_stock_data(ts_code)
    stock_name = fetch_stock_name(ts_code)
    plot_stock_data(df, stock_name, ts_code)

# 获取所有ts_code
all_ts_codes = fetch_all_ts_codes()

# 通过SQL查询动态获取股票代码
#defined_ts_codes = fetch_defined_ts_codes()
defined_ts_codes = ['002138.SZ', '603017.SH']
# 过滤所有股票代码,只保留defined_ts_codes中的代码
all_ts_codes = [code for code in all_ts_codes if code in defined_ts_codes]

def plot_next_stock(event=None):
    global current_index
    ts_code = all_ts_codes[current_index]
    df = fetch_stock_data(ts_code)
    stock_name = fetch_stock_name(ts_code)
    plot_stock_data(df, stock_name, ts_code)

# 初始化图表和按钮
fig, (ax1, ax2, ax3) = plt.subplots(3, 1, figsize=(15.12, 8.55), sharex=True)  # 设置图表大小
fig.subplots_adjust(hspace=0.3, right=0.85, top=0.85, bottom=0.15, left=0.06)  # 设置子图间距和边距

# 添加上一个和下一个按钮
axprev = plt.axes([0.6, 0.01, 0.1, 0.05])  # 调整按钮位置
axnext = plt.axes([0.71, 0.01, 0.1, 0.05])  # 调整按钮位置
bnext = Button(axnext, 'Next')
bprev = Button(axprev, 'Previous')

def next(event):
    global current_index
    current_index += 1
    if current_index >= len(all_ts_codes):
        current_index = 0
    update_plot()

def prev(event):
    global current_index
    current_index -= 1
    if current_index < 0:
        current_index = len(all_ts_codes) - 1
    update_plot()

bnext.on_clicked(next)
bprev.on_clicked(prev)

# 显示第一个股票的图表
plot_next_stock()
plt.show()
